🔬 Technical Overview
TABMON combines autonomous acoustic sensing, AI-based analysis, and standardised ecological workflows to turn soundscapes into comparable biodiversity indicators across countries. The framework covers everything from site selection and device operations to data logistics, model inference, uncertainty handling, and indicator reporting aligned with policy needs.
📦 Work Packages
🌐 WP1 — Network Deployment & Data Logistics
WP1 designs and operates the field network. Sites are chosen along key biogeographic and land-use gradients to capture meaningful spatial and temporal variation. Devices are provisioned to consistent specifications and deployed with clear field protocols so recordings are comparable across partners. Quality assurance and control are applied from the moment audio is captured—covering device health, clock drift, gain settings, and basic signal diagnostics. Data are transferred from the cloud to secure archival storage (NIRD) on a managed schedule, ensuring traceability from raw audio to downstream analyses.
In WP1 we are also working towards a standard Passive Acoustic Monitoring (PAM) metadata standard to make acoustic data easily shareable. More information here.
🤖 WP2 — AI to Essential Biodiversity Variables
WP2 turns audio into ecological information. Model inference pipelines detect species and characterise community patterns; embeddings and acoustic features support both supervised and semi-supervised analyses. Uncertainty is treated explicitly: confidence from detectors/classifiers is carried forward and reflected in all derived metrics. Outputs are aggregated into indicators compatible with Essential Biodiversity Variables (EBVs), making results comparable across sites and years and suitable for integration with existing monitoring schemes.
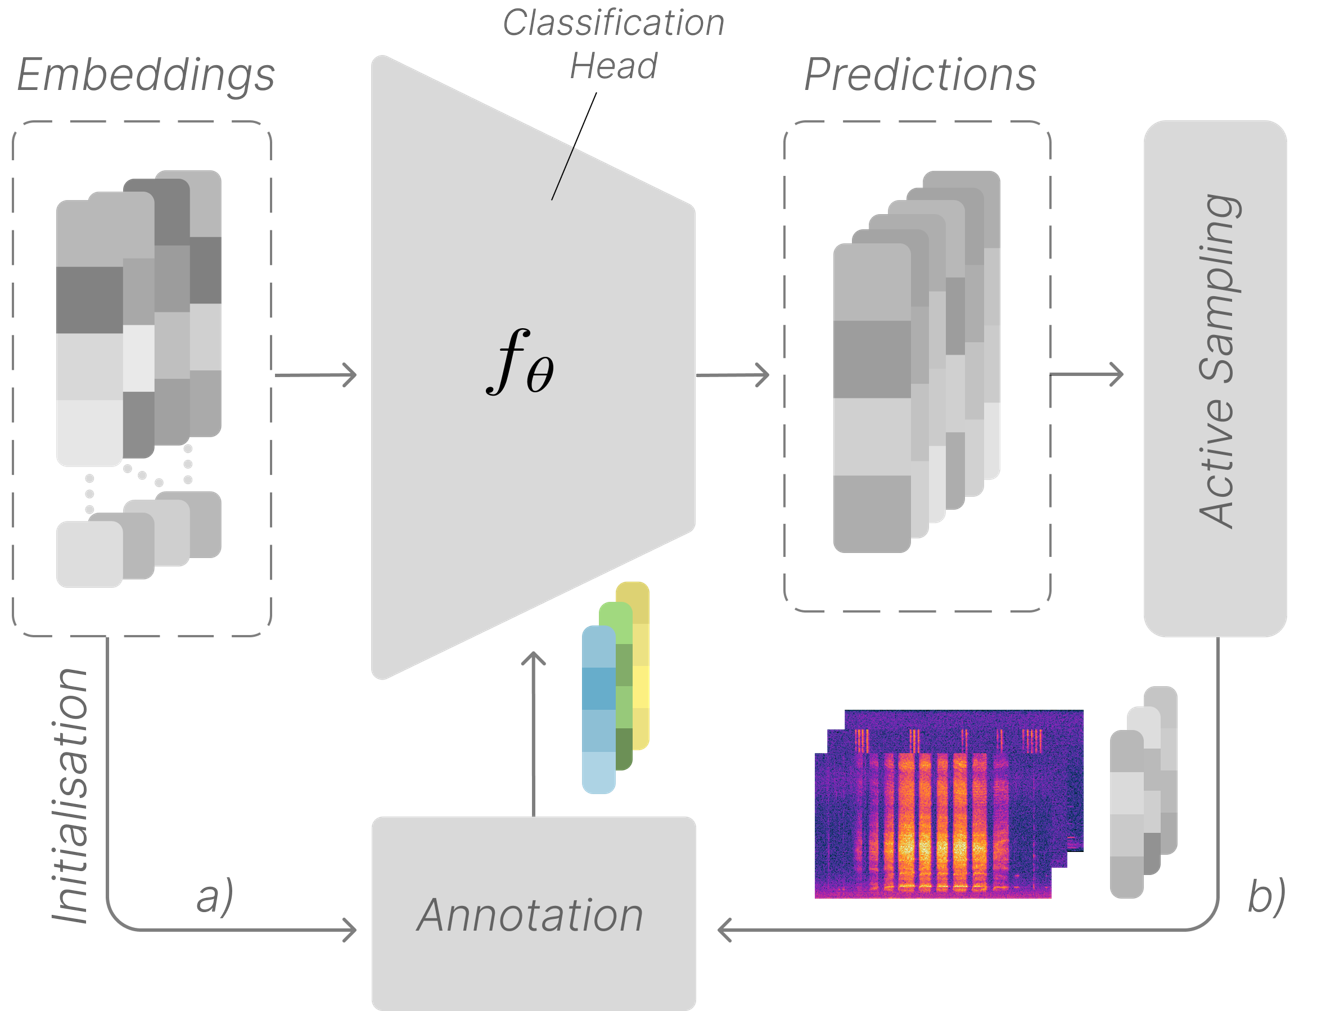
Figure: Active learning pipeline for species detection and classification in acoustic monitoring data
🏛️ WP3 — Policy Integration & Outreach
WP3 focuses on making outputs usable. It assembles synthesis products and technical reports that explain methods, assumptions, and limitations. Interactive dashboards present deployments, data coverage, and headline indicators with enough context to interpret trends. The team engages with competent authorities and programme owners to align indicators with national reporting requirements and to ensure interoperability with ongoing monitoring.
🎧 Devices & Data Ingestion
📡 Hardware Infrastructure
TABMON uses cost-effective real-time acoustic recorders (Bugg) that can stream audio over mobile networks to the cloud. The units support higher-quality external microphones where needed and can operate at higher sampling rates for taxa such as bats and insects. The network is designed for scale, with an initial target of roughly 100 devices distributed across participating countries. Power strategies include solar-assisted deployments for remote sites, with installation and maintenance procedures documented to keep downtime low.
🔄 Data Pipeline (Simplified)
Audio is streamed from devices to the cloud and mirrored to NIRD for durable archiving. Processing runs in batch or near real time, depending on connectivity and use case, and covers detection, classification, and embedding generation. Post-processing aggregates events into site- and time-window summaries, applies quality checks, and calculates indicators. The resulting datasets feed dashboards and public releases, with provenance linking indicators back to raw audio and model versions.
🧮 Modelling & Indicators
🔍 Detection & Classification
Inference starts at the event level: species- or community-level detections are produced with associated confidence. These detections are aggregated to site, day, and season, and joined with environmental covariates (e.g., weather or habitat descriptors) for context. Uncertainty is quantified and propagated so that downstream summaries and trends carry interpretable confidence intervals.
📈 Biodiversity Indicators
Indicators cover complementary dimensions: occurrence (where and when species are detected), abundance/activity proxies (relative rates or acoustic activity as appropriate), and phenology (seasonal timing and migration signals). Each indicator includes metadata on effort, model version, and uncertainty. The intent is comparability across sites and years, with clear caveats where methods or effort differ.
🔄 Reproducibility & Open Science
Code, configurations, and model cards are versioned in public repositories where licensing permits. A deployment dashboard reports device status and metadata to make coverage and effort transparent. Protocols and workflow diagrams document the path from audio to indicators, and data releases follow FAIR principles whenever possible. Methods are validated and refined through peer-reviewed publications and open benchmarking.
Interested in the technical details? 💻 Check out our resources and code repositories or explore the dashboard and technical documentation from our analysis pipeline.